100% parity on the consumed release suite
GPU INFERENCE / MEASUREMENT / RELEASE CONTROL
Faster inference.
Evidence for every release.
FinServe connects GPU serving, distributed routing and automated quality gates. Compare configurations, inspect the requests behind the numbers, and catch regressions before promotion.
Free public results site. Run the full explorer and GPU inference on your own hardware.
LATEST VERIFIED LOCAL GPU RELEASE
From model build to approved deployment.
The complete Airflow workflow passed with real GPU engines: collect evidence, evaluate gates, deploy, observe 60 probation probes, and clean up the baseline.
247 ms to 116 ms with prefix caching
256 per configuration, separate warmups
First response, sooner.
Median client TTFT; lower is better. Linear scale from zero.
Short, ordered 3B AWQ experiment on one shared RTX 4070 Laptop GPU; both engines use a 512 MiB KV cache. This is separate from the sustained compiled comparison below. The release suite is consumed regression evidence; broader quality failures remain, and no fresh-holdout quality or production SLA is claimed.
HISTORICAL COMPILED-SERVING EXPERIMENT / RTX 4070 LAPTOP GPU
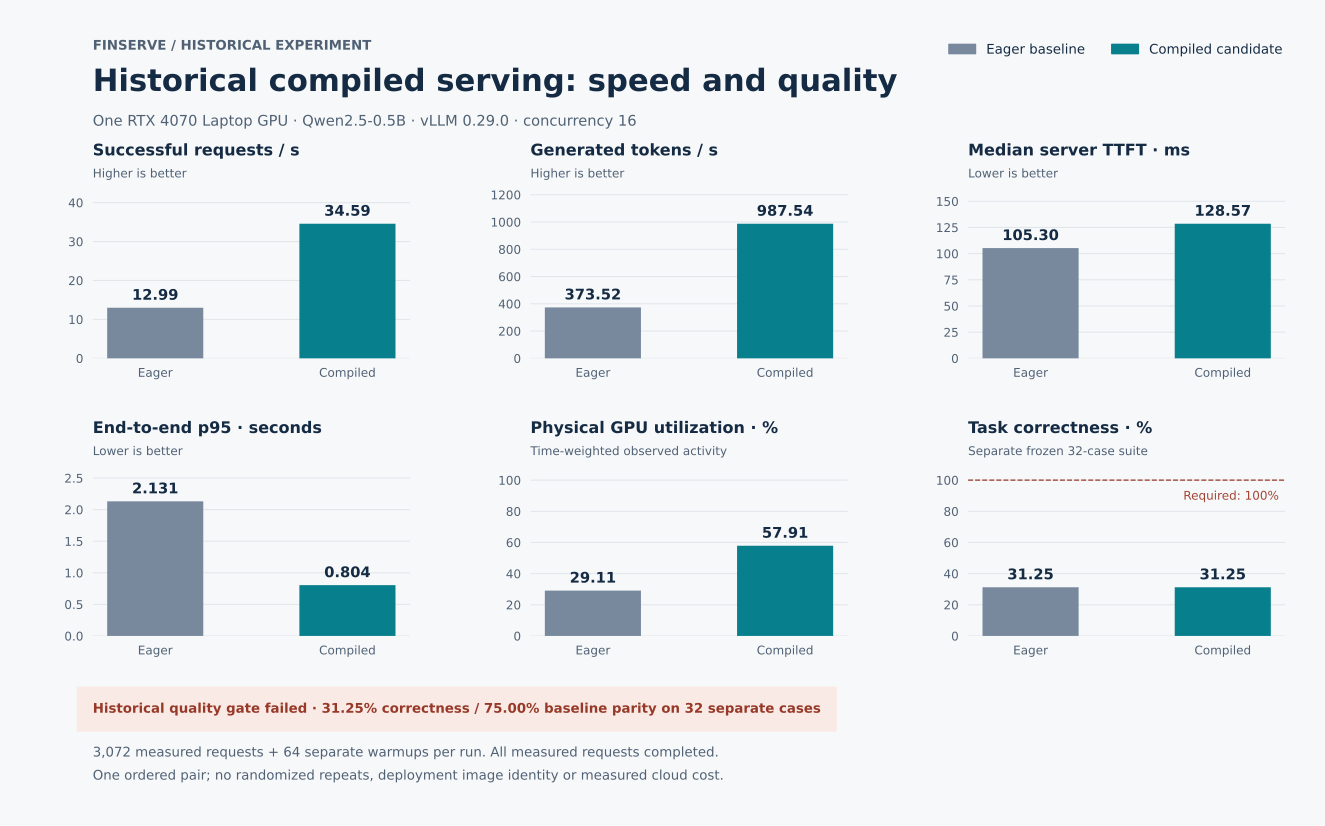
More tokens. Shorter tail latency.
A sustained eager-versus-compiled vLLM comparison used the same frozen workload, with 3,072 measured requests per configuration and separate warmups.
373.52 to 987.54 tokens/s
2.131 s to 0.804 s
Across both configurations
Throughput at the same client concurrency
Generated tokens / secondLinear scale from zero. Same pinned 0.5B model and workload; concurrency 16.
Historical experiment: quality gate failed. This historical candidate failed its separate quality check. Median server TTFT rose from 105.30 to 128.57 ms. One ordered local comparison does not establish production availability or cloud cost savings. The passed 3B release above and the broader 7B study below are separate experiments.
BUILT BEYOND THE BENCHMARK
A serving system you can inspect.
GPU engines, bounded admission
vLLM and SGLang adapters connect to FastAPI streaming. Ray routing tracks endpoint eligibility and request leases.
Keep the evidence
Compare throughput, latency and GPU coverage in the explorer. Trace measurements to frozen workloads, artifact identities and retained request records.
Make quality part of release control
CLI and Airflow share a release gate. Failed checks block promotion; revision checks protect warm route rollback.
BROADER QUALITY STUDY / 7B QUANTIZED CANDIDATE
32 of 32 release answers correct.
The selected 7B candidate answered 55/56 regression cases correctly (98.2%), up from 52/56 for the previous 3B run. All 56 HTTP requests completed. The cards show correctness by suite.
Release cohort
100% 32/32
Release correctness remains 100%; the earlier 1.5B run scored 81.25%.
Historical regression
100% 4/4
Four previously consumed regression cases.
Expanded regression
95% 19/20
Previously held-out cases; now used as regression evidence.
One regression error remains in this separate 7B study. All three suites have been consumed. These scores do not establish fresh-holdout performance or quality parity. The independent evaluation below measures the selected model on newly generated cases.
INDEPENDENT EVALUATION / FROZEN BEFORE INFERENCE
42 of 48 new cases correct (87.5%)
The same selected 7B configuration completed all 48 requests. Six answers failed across operating margins, decimal arithmetic, scientific notation and yes/no reasoning. This result is separate from the 55/56 regression score; it does not pass the quality gate.
The suite and model selection were frozen before this single evaluation. These cases are now consumed; no tuning or repeat run was used to improve this score.
EXPERIMENT ARCHIVE
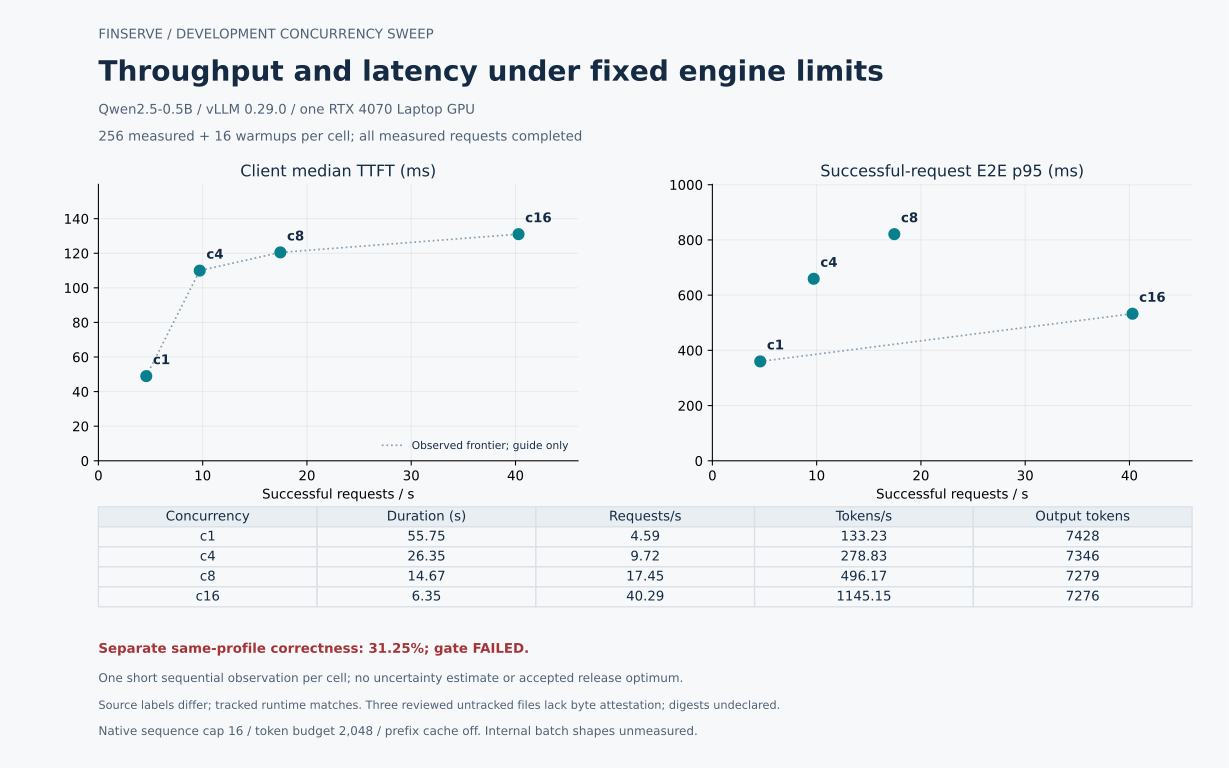
Explore the concurrency tradeoff.
Four sequential 256-request development cohorts compare throughput and latency as client concurrency changes. These historical runs failed separate quality qualification and lack source-byte attestation; they do not identify an approved production setting.
Open the historical concurrency figure

RUN IT YOURSELF
Start with the evidence explorer.
The explorer runs on CPU. Add your own NVIDIA GPU for inference. Local setup needs no paid hosting subscription.